The Cross-Marketplace: Performance dashboard allows you to view and compare key advertising metrics across all your connected Amazon marketplaces — all in one place. This helps you gain a clear overview of how your ads perform globally, identify trends, and make data-driven decisions faster.
Note: This feature is currently in Beta. Your feedback during this phase is invaluable as we continue improving the dashboard.
Accessing Cross-Marketplace: Performance
-
Click Dashboards in the left-hand menu
-
Select Cross-Marketplace (BETA) → Marketplace Performance
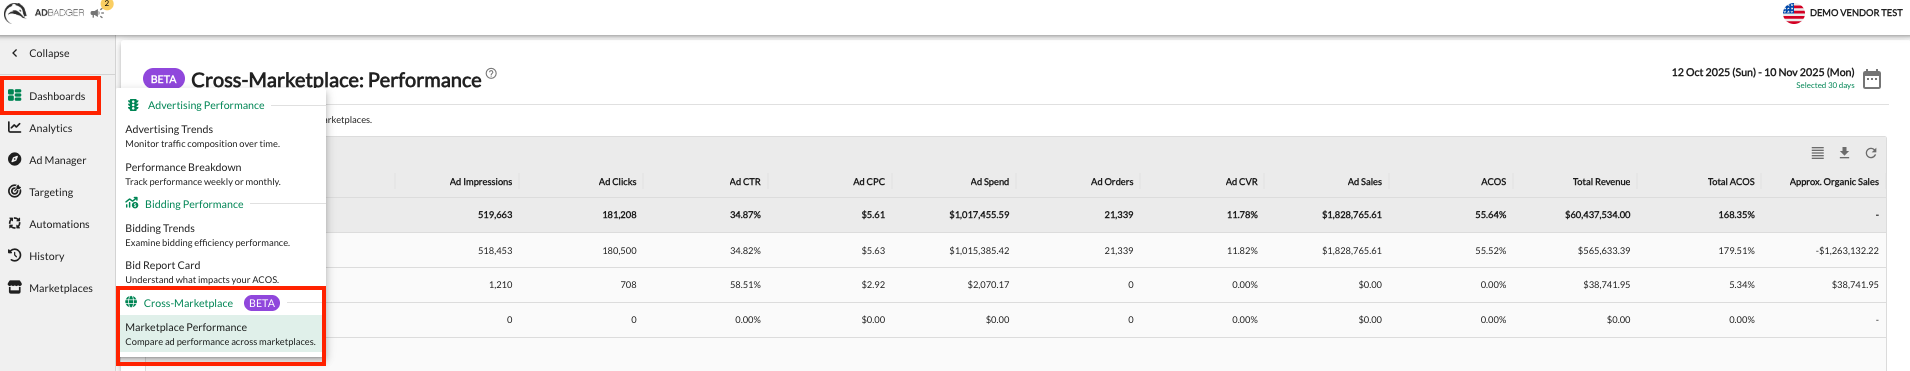
Using Cross-Marketplace: Performance
Compare Multiple Marketplaces
- View all connected marketplaces to identify top-performing regions
Analyze Over Any Timeframe
-
Use the date selector (upper-right corner) to choose custom ranges (e.g., last 7 days, last 30 days)
-
You can also enable time comparison in the date picker to compare performance between two different time periods — helping you quickly spot performance shifts.
Sort and Filter Metrics
-
Click column headers to sort by spend, sales, ACOS, or other key metrics
-
To identify where attention is needed most, sort by ACoS increase to see which marketplaces have higher costs compared to the previous time frame.
-
Apply filters to focus on specific marketplaces or campaigns
Track Trends and Make Decisions
-
Hover over charts for detailed metric values
-
Spot trends across marketplaces to guide campaign adjustments and budget allocation
Tips for Best Use
-
Use time comparison regularly to understand performance changes between periods.
-
Export data for deeper analysis or reporting.
-
Check trends frequently to identify top-performing regions and optimize your strategy
Need Help?
💬 Reach out to our Support Team anytime through the Live Chat bubble in the lower-right corner of the tool.